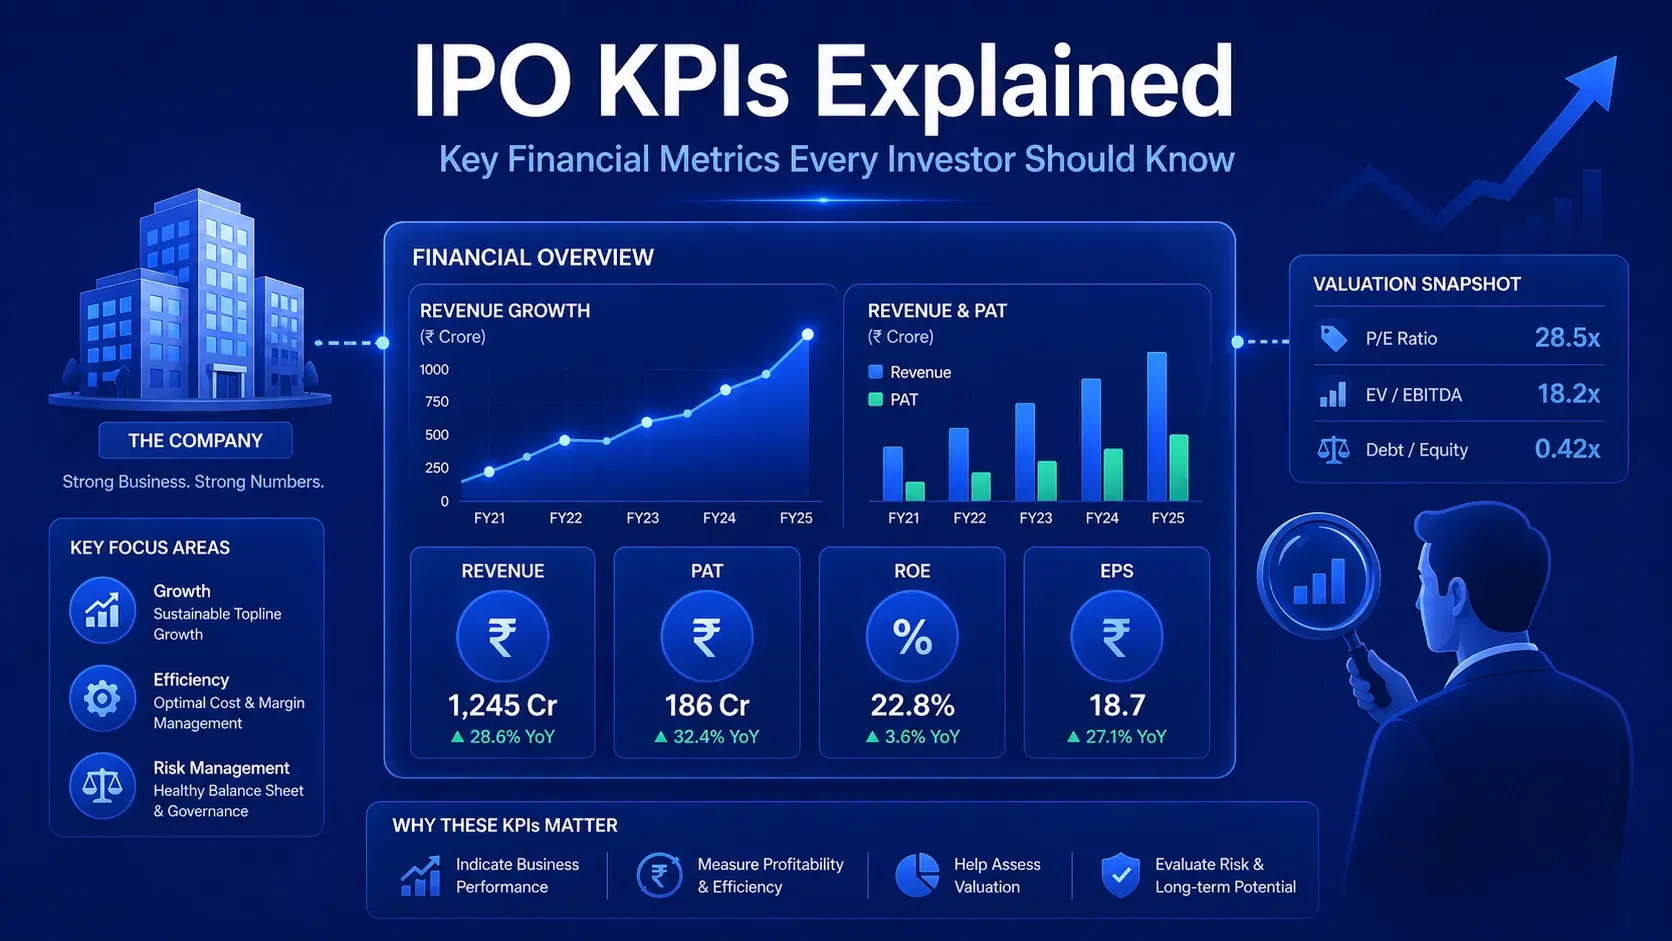
You need to understand the company’s health when investing in an Initial Public Offering (IPO) or any stock. You should have easy instruments to verify whether the company is performing well. These are referred to as Key Performance Indicators (KPIs). KPIs illustrate the performance of a business in a given period of time.
KPIs are highly significant both to the company itself and to individuals who may invest money.
Keep in mind this single rule: Do not consider a company investment based on a single KPI. You have to see some of them collectively in order to have a complete picture.
Key KPIs Every Investor Needs to Know
We shall examine some of the typical financial KPIs. These KPIs assist you in knowing the profitability, money management, and efficiency of the company.
- Revenue from Operations (The Top Line)
This figure is the amount of money that a company earns out of its core business, and it does not involve money earned as a result of side activities such as bank interest or selling an old piece of land.
This number indicates the strength of the company’s sales. This is referred to as the top line of the company since it appears at the top of the profit and loss statement.
Why it is important: When this number is increasing, then a company is generally doing well. The percentage of growth should be checked to determine whether sales are growing or remaining stagnant.
| Trend | Investor Signal |
|---|---|
| Increasing growth % | Good sign. Sales are accelerating. |
| Consistent growth % | Caution. Sales are not growing but stable. |
| Decreasing growth % | Not a good sign. The growth in sales is declining. |
- Profit after tax (PAT) (The Bottom Line)
Profit After Tax or PAT is the true net income that is available to the company that remains after meeting all the expenses, including taxes.
PAT is a good indicator of the financial well-being of the company. It demonstrates the level of cost management effectiveness of the company. The larger the PAT, the greater the profitability. This is referred to as the bottom line.
You add all the income (operations and other) and deduct all expenses and the tax bill.
When PAT is positive, then that is profit. A negative PAT indicates that the company has made a loss.
| Trend | Investor Signal |
|---|---|
| Increasing PAT | Very good sign. Higher profits. |
| Consistent PAT | Good sign. Profits are stable. |
| Decreasing PAT | Caution. Profits are declining. |
| Sudden big change in PAT | Look for the reason. It could be a one-time event. |
- PAT Margin (Percentage of Profitability)
PAT Margin indicates the extent to which the sales revenue of the company turns into profit.
The high PAT margin (percentage) indicates that the company is very efficient in managing its costs and taxes. It is a good test of the financial health of the company.
| Trend | Investor Signal |
|---|---|
| Higher PAT Margin | Very good sign. Increased sales money is profit. |
| Lower PAT Margin | Good sign. This is usually normal, but check peers in the industry. |
| Negative PAT Margin | Caution. The company is incurring losses in sales. |
| Sudden big change in PAT Margin | Look for the reason. It might be a one-time situation. |
- Return on Capital Employed (RoCE)
RoCE is a measure of how well the company is utilising all the money invested in it (owner money as well as debt) to generate a profit.
It is a measure of the profit made on the total amount of capital invested in the business. This is usually highlighted by companies that are about to go through an IPO.
The Objective: Investors will like businesses that generate a higher return from the capital they use.
The Benchmark: Typically, a 15-20% and above RoCE is good. You must compare this number with other companies and other firms operating within the same line of business.
| Trend | Investor Signal |
|---|---|
| Increasing RoCE | Very good sign. There is better utilisation of capital. |
| Consistent RoCE | Good sign. Constant efficiency of capital utilisation. |
| Decreasing RoCE | Caution. The company is becoming less efficient. |
- Return on Equity (RoE)
RoE is like RoCE, only that it examines the profit earned on the amount invested by the owners (equity of shareholders). It ignores debt.
It shows the company’s ability to generate profit using only the owner’s capital.
The Calculation: You take the net profit of the company and divide it by the equity of the shareholder.
Important Check: A high RoE is good. Nevertheless, you have to look at the debt of the company as well. Sometimes, a company takes on a lot of debt to boost RoE artificially. Always look at other factors as well.
| Trend | Investor Signal |
|---|---|
| Increasing RoE | Very good sign. High return for owners. |
| Consistent RoE | Good sign. Stable return for owners. |
| Decreasing RoE | Caution. Reduced returns for owners. |
| Also, check for debt components | The company should not rely too much on debt. |
- Return on Net Worth (RoNW)
Another profitability indicator is RoNW associated with the net assets of the company. The total assets minus the total liabilities are known as net worth.
RoNW, as an IPO issuer, indicates the efficiency of the company in utilising its net assets (equity and reserves) to make profits. It is an alternative method to measure the return for the owners.
| Trend | Investor Signal |
|---|---|
| Increasing RoNW | Very good sign. Effective use of net assets. |
| Consistent RoNW | Good sign. Stable efficiency in net asset use. |
| Decreasing RoNW | Caution. Efficiency is dropping. |
- Debt Equity Ratio
This ratio indicates the financial structure of the company. It indicates the proportion of money obtained as loans (debt) and as owner money (equity).
It shows the degree of dependence of the company on loans. A high ratio is dangerous as it means that the company has more debt than equity and may not be able to repay loans.
Industry Factor: The perfect ratio (typically 1 to 1.5 or 2) varies according to the industry. Manufacturing or finance companies require a lot of capital, and hence their ratio may be greater.
| Trend | Investor Signal |
|---|---|
| Decreasing ratio | Good sign. The company is decreasing its debt. |
| Increasing ratio | Caution. The company is relying more on borrowing. |
| Ratio of 1-1.5 | Usually good, however, see the sector of the company. |
- Earnings per Share (EPS)
EPS is a profitability ratio that indicates the amount of profit that each individual share receives. It informs an investor of the amount of profit that the company makes per share.
Types of EPS:
Basic EPS: It uses the actual number of shares outstanding.
Diluted EPS: Uses a higher number of shares, assuming all possible convertible securities (such as warrants) are converted into shares. Diluted EPS gives a more careful, or “conservative,” view.
A higher EPS is normally a sign of a more profitable firm.
| Mar-23 | 2 |
| Mar-22 | 1.1 |
| Mar-21 | 0.41 |
In the example table, the EPS has a clear increasing trend. This is a very good sign.
| Trend | Investor Signal |
|---|---|
| Increasing EPS | Very good sign. Profit per share is rising. |
| Consistent EPS | Good sign. Profit per share is stable. |
| Decreasing EPS | Caution. Profit per share is falling. |
- Price to Earnings Ratio (P/E Ratio)
One of the valuation tools is the P/E ratio. It lets you know whether a share price is too low (undervalued) or too high (overvalued).
It indicates the price that investors are ready to pay per ₹1 of profit the company will get. If the P/E is 15, you pay Rs. 15 for ₹1 in earnings.
The Check: A low P/E ratio generally implies that the stock is less expensive. However, a high P/E may indicate that investors believe that the company has huge future growth potential.
The Rule: It is always important to compare the P/E ratio with other firms within the same industry. The typical P/E is usually 20-25, though this differs considerably.
| Ratio Level | Investor Signal (General View) |
|---|---|
| Lower P/E Ratio | The stock is said to be fairly priced. |
| Higher P/E Ratio | The stock is said to be over-priced (with potential of high future growth). |
- EBITDA Margin
EBITDA is Earnings Before Interest, Taxes, Depreciation, and Amortization. The EBITDA Margin represents the percentage of the sales that turn into earnings prior to the removal of those four items.
This is an indicator of how good the company is at managing its core operating expenses. It shows operating efficiency.
The Formula: You add back interest cost, taxes, depreciation, and amortization to the Profit After Tax (PAT). Then, you compare this EBITDA number to the sales revenue as a percentage.
The Benchmark: An EBITDA margin of 10 per cent or higher is generally deemed to be a good measure.
| Trend | Investor Signal |
|---|---|
| Increasing trend | Good sign. Operating efficiency is improving. |
| Decreasing trend | Caution. The cost of operation is possibly rising too fast. |
- Price to Book Value (P/B Ratio)
Another valuation tool is the P/B ratio. It is a comparison of the market price of a share with the book value (Net Asset Value or NAV) per share.
It assists in determining whether a stock is over- or underpriced according to the assets of the company. Total assets less total liabilities are the book value.
The Check: A large P/B ratio indicates that the stock is overpriced in the market relative to the value of its physical assets.
General Range: Stocks that have a P/B ratio of 1-3 are sometimes considered undervalued, but you must check the industry norms.
| P/B Ratio Range | Investor Signal (Generic View) |
|---|---|
| 1-3 | Undervalued stocks |
| 3-15 | Fairly priced stock |
| More than 15 | Overvalued stock |
- Market Capitalization (Market Cap)
Market Cap is merely the total market value of all the company’s outstanding shares. It is the most popular method of measuring the size of a company in the stock market.
Formula = Current Share Price x Total Number of Outstanding Shares.
Why it is important: Market Cap assists investors in knowing about risk and returns. There are three broad categories of companies:
| Category | Typical Market Cap (Example) | Risk/Return Profile |
|---|---|---|
| Large Cap | Rs 20,000 crore or more | Lower risk, considered stable, consistent profits. |
| Mid Cap | Rs 5,000 to Rs 20,000 crore | Growth potential, which is frequently in expanding industries, moderate risk. |
| Small Cap | Below Rs 5,000 crore | Greater growth potential, greater volatility and risk. |
IPO Investor Conclusion
The initial step of deciding to invest is financial measures. They enable you to get a quick overview of the profitability, efficiency, and riskiness of a company. You need to look at how each of these measures has changed over time. You also need to compare them with the competitors of the company and the average of its industry. You must look beyond the numbers in order to make a smart IPO decision. You should also check out the company’s leadership, why they are going public, and how well the industry as a whole is growing should also be checked out by you.


No comments yet. Be the first to share your thoughts!